Top Ten Sale Items
| Metric Name | Listed Under Display Item | Information Source(s): | Description |
Views |
|---|---|---|---|---|
| Top 10 Sale Items | POS |
DataTrak Sales |
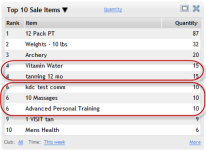
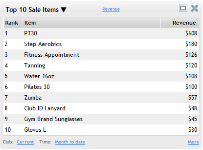
The Top 10 Sale Items metric displays information about the ten items that produce the highest sales, or have been sold in the greatest quantity for the selected time period. |
|
Columns in this metric:
- Rank: Products are ranked 1-10, with 1 being the source of the highest sales or the product or service with the greatest quantity sold.
If the sales amount or the quantity sold for any two or more products is the same, they will have the same rank. Only ten items will be displayed.
- Item: The name of the item.
- View: Select one from the Configure Options menu:
- Sales: Total sales from each product.
- Quantity: Total number sold.
Unlike many of the other metrics, columns in the Top 10 Sale Items cannot be sorted in ascending or descending order. They are fixed in ascending order according to rank.
Note: Non-asset items (such as Club Account Payments) will not be displayed in this metric, since they do not represent a product or service being sold.
Note: The profit centers displayed by this metric follow these criteria:
- Both active and inactive profit centers are displayed.
- Only Club-managed profit centers are displayed.
- rofit centers that have been renamed.
Example: Protein Bar belonged to the profit center Consumables until January 1, 2013. On that date, the profit center was renamed to Snack Bar. Data prior to January 1, 2013 will display income from protein bars under the profit center Consumables, while income from protein bars after January 1, 2013 will be categorized under the profit center Snack Bar.
Metric Options
To configure options, hover the cursor over the metric title.
Select Configure Options from the drop-down menu.
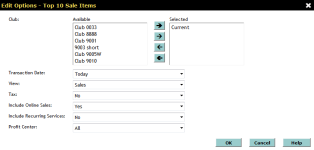
These options are as follows:
Club: Select the club(s) you want to display. Show me how to use the multi-select list.
Transaction Date: The date range that will be displayed:
- Today
- Yesterday
- This Week
- Last Week
- Last 7 Days
- This Month
- This Month (Month to Date)
- This Month (Mid Month)
- Last Month
- Last Month (Month to Date)
- Last Month (Mid Month)
- This Month Last Year
- This Month Last Year (Month to Date)
- Custom - This option allows you to select a custom date range in the date fields to the right (See Using Custom Date Ranges).
This metric has a maximum date range of 31 days.
View: Select either Revenue or Quantity
- Sales: Total sales from each product
- Quantity: Total number sold
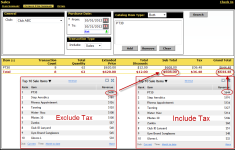
Tax: Choose to include or exclude tax when configuring displayed revenue. This will not affect the Quantity View. If tax is included, the value found in the Sub Total column of the DataTrak Sales page will be displayed. If tax is excluded, the value found in the Grand Total column of the DataTrak Sales page will be displayed.
Online Sales: Choose to include or exclude sales made online.
Recurring Services: Choose to include or exclude Recurring Service sales.
Profit Center: Choose a profit center to display or select All to display all profit centers.
Item Type: Display products, services, or both (All).
After making your changes in the Edit Options Menu, click OK to save the configuration.
More information
Click the More link in the bottom right corner of the panel to view information related to the metric on other pages in DataTrak. The More Information menu will list different links for each metric.
This metric provides the following link(s) to related DataTrak pages:
 © 2024 ABC Fitness Solutions, LLC.


