Prospects
| Metric Name | Listed Under Display Item | Information Source(s): | Description |
Views |
|---|---|---|---|---|
| Prospects | Member |
Manage Members: Membership Types and Issue Date |
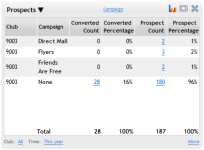
The New Prospects metric displays new prospects listed by campaign or lead priority. |
|
Columns in this metric:
This metric allows many of the columns to be removed or displayed by using the Options menu. See Columns below.
- Club: Displays the number of the club the prospect is associated with.
Note: If the Combine Clubs option is set to Yes, this column will not display. - The second column displays the View selected from the Options menu. See Views below.
- Converted Count: The number of former prospects who have joined. If this number is greater than zero, you can click on the number to open a detailed list of former prospects who joined the club.
Note: Click the number displayed in this row to open a detailed list of these prospects. - Converted Percentage: The percentage of prospects from the previous column who have joined.
- Prospect Count: The number of prospects in this row. Click the number shown to open a detailed list of prospects in this group.

- Prospect Percentage: The percentage of total prospects displayed in this row (Prospect Count ÷ Total Prospect Count).
The Total for each column is listed at the bottom of the metric.
Metric Options
To configure options, hover the cursor over the metric title.
Select Configure Options from the drop-down menu.
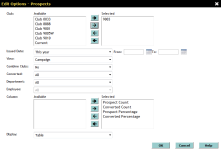
These options are as follows:
Club: Select the club(s) you want to display. Show me how to use the multi-select list.
Combine Clubs:
- Yes: Remove the Club column and treat all information as if belonging to one club. This will also remove the club number from the other displays (pie chart, line graph, and bar graph).
- No: Keep the Club column to identify which club a prospect is associated with.
Issued Date: Select the Issue Date as listed in the Dates submenu of Fast Add: Prospect.
- Today
- Yesterday
- This Week
- Last Week
- Last 7 Days
- This Month
- This Month (Month to Date)
- This Month (Mid Month)
- Last Month
- Last Month (Month to Date)
- Last Month (Mid Month)
- This Month Last Year
- This Month Last Year (Month to Date)
- Custom - This option allows you to select a custom date range in the date fields to the right (See Using Custom Date Ranges).
This metric has a maximum date range of 31 days.
- Campaign: Display Prospects based on the Campaign entered in the Sales submenu of Fast Add.
-
Lead Priority: Display Prospects based on the Lead Priority entered in the Sales submenu of Fast Add.
- Sales Person: Display the sales person associated with the prospective member.
- Zip Code: Displays the Zip code entered in the prospective member's Demographics submenu on the Members page.
- Issued Month: Displays Prospects by issued month and year, entered in the Dates submenu of Fast Add: Prospect.
- Days to Convert: The number of days it took a formerly prospective member to join. If this view is selected, the Converted option will be fixed to Yes, and the columns will be fixed to include only Prospect Count and Prospect Percentage.
- City / State: Displays the city and date associated with the member, entered in the Address submenu of Fast Add: Prospect.
Converted:
- Yes: Select Yes to display only former prospective members who joined the club. This will make every row in the Percentage Converted column 100%.
- No: Select No to display only prospective members who have not joined the club. This will make every row in the Percentage Converted column 0%.
- All: Select All to display both converted and unconverted prospective members.
Department: Select a department to display or select All.
Employee: Select a single employee to display or select All. If you have selected all departments, this option will be grayed out and fixed to All.
Column: Select the columns you wish to display using the multi-select list (See Multi-Select List).
You must select at least one column. Additionally, the selected View column and Club column (if Combine Clubs is set to No) will display.
- Converted Count
- Converted Percentage
- Prospect Count
- Prospect Percentage
Display: The data in the Electronic Agreement Totals metric can be displayed in the following ways:
- Switch to Bar Graph Display

Hover the cursor over the bars on the bar graph to see more information in this format: Campaign or Lead Priority name (depending on the selected view), value (number of new prospects in this campaign or with this lead priority).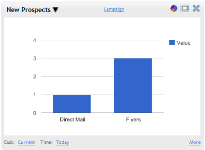
- Switch to Pie Chart Display

Hover the cursor over the sections of the pie chart to see more information in this format: Campaign or Lead Priority name (depending on the selected view), number of new prospects, (percentage of the total).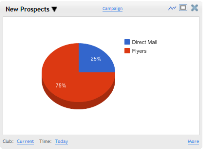
- Switch to Line Graph Display

Hover the cursor over the points on the line graph to see more information in this format: Campaign or Lead Priority name (depending on the selected view), value (number of new prospects in this campaign or with this lead priority).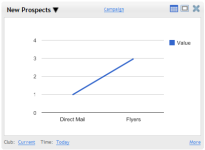
- Switch to Table Display

The table is the default display for this metric, and will show all information selected in the options menu.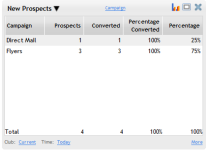
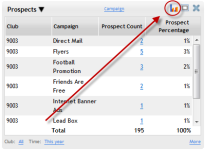
Note: the Display can also be changed by clicking the display icon on the metric toolbar. Click multiple times to rotate through the displays.
After making your changes in the Edit Options Menu, click OK to save the configuration.
More information
Click the More link in the bottom right corner of the panel to view information related to the metric on other pages in DataTrak. The More Information menu will list different links for each metric.
This metric provides the following link(s) to related DataTrak pages:
- When using the Campaign view, sort by the Percentage and Percentage Converted columns to identify your most successful campaigns. In descending order, the greatest values will be at the top.
See Sorting Columns.
 © 2024 ABC Fitness Solutions, LLC.
