Event Service Balance
| Metric Name | Listed Under Display Item | Information Source(s): | Description |
Views |
|---|---|---|---|---|
| Event Service balance | Scheduling |
DataTrak Calendar, Events, Member Pages: Events |
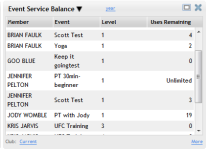
The Event Service Balance metric displays the members who have attended an event hosted by the selected employee and the remaining uses for each member. |
Event Uses Remaining by Member |
Columns in this metric:
- Member: The name of the member who has attended the selected event, hosted by the selected employee.
- Event: The name of the event type.
- Level: The event level. This column will only show multiple levels if the Level option is set to All in the metric Options menu.
- Uses Remaining: The number of funded events of this type that the member may still schedule.
Metric Options
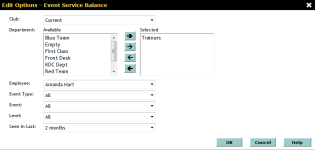
To configure options, hover the cursor over the metric title.
Select Configure Options from the drop-down menu.
These options are as follows:
Club: Choose the club you want to display. This metric only displays one club at a time.
Department: Select the department from the multi-select list.
Show me how to use the multi-select list.
Employee: Select the employee to display.
Due to the fact that the displayed employee list for these Scheduling metrics is limited to the first 200 employees, the criteria for employees to be displayed has changed.
For employees listed in the Employee selection option for these metrics, ALL of the following must be true:
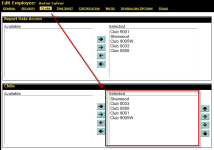
- The employee must be able to log in to the selected club. Club access is configured from the Clubs tab of the Edit Employee page in DataTrak.
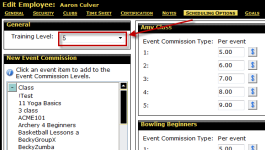
- The employee must have a Training Level of 1 - 5 set. Employees with a Training Level set to None will not display. Training levels can be set from the Scheduling Options tab of the Edit Employee page in DataTrak.
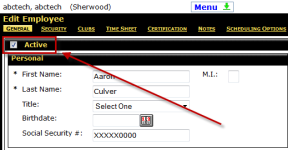
- The employee must be set as Active. The Active flag can be turned and off from the General tab on the Edit Employee page in DataTrak
Event Type: Select the type of event to display.
- All: Display both appointments and classes.
- Appointments Only
- Classes Only
Event: Select the event to display or select All.
Level: Select the event level to display or select All.
Seen in Last: Select the members to display based on when they last completed a scheduled event.
- Month
- 2 Months
- 3 Months
- 6 Months
- Year
After making your changes in the Edit Options Menu, click OK to save the configuration.
More information
Click the More link in the bottom right corner of the panel to view information related to the metric on other pages in DataTrak. The More Information menu will list different links for each metric.
This metric provides the following link(s) to related DataTrak pages:
The Reports link will open the DataTrak Manage Reports page to the Dashboard Category and the metric Subcategory. From here, you can run the report that will show the same information displayed in Dashboard.
See: Manage Reports
 © 2024 ABC Fitness Solutions, LLC.
