Inventory Analysis
Report Overview
This report displays inventory quantity stocked, sold, and remaining during the time period selected. Use this report to monitor inventory sales and remaining stock available in one view. If inventory quantities are corrected, changes are reflected in the Quantity Corrected column.
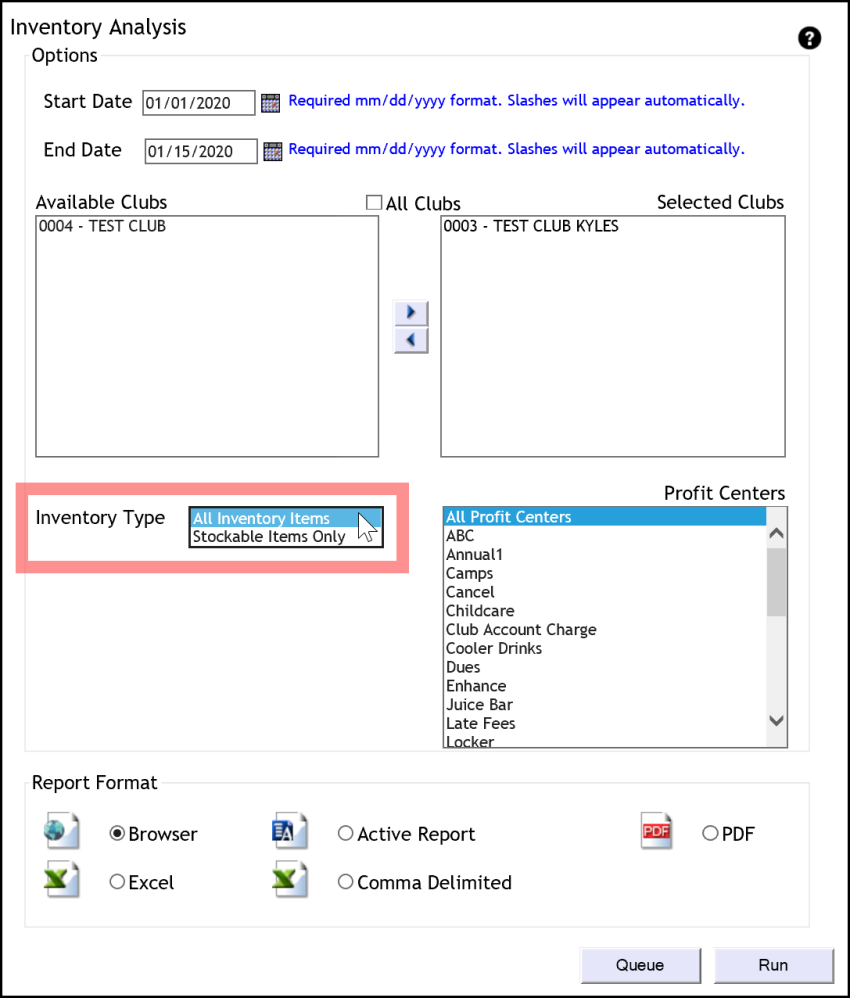
You can customize profit center selection to focus the report on a subset of items, or you can run the report by the default setting which includes all profit centers.
The report shows the amount ordered by items received and manual adjustments.
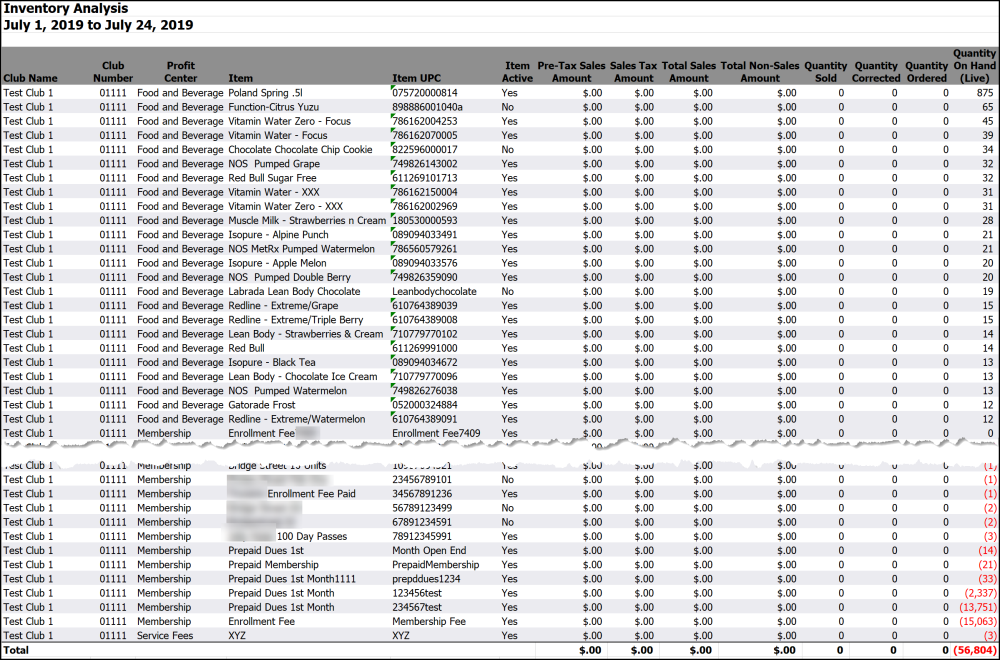
Cost of Goods Sold is found by multiplying Unit Cost with Quantity Sold. Gross Profit Margin is found by adding together the Pre-Tax Sales Amount and the Cost of Goods Sold then dividing that number by Pre-Tax Sales Amount.
In aggregate reports, each item must exactly match on profit center, item , item UPC, item active, inventory type, and unit cost to be grouped together under the same item. For example, if one club includes hats under the Accessories profit center while another includes hats under the Clothing profit center, there will be two separate report entries for hats. To make this report more accurate, uniformly set up items across clubs in DataTrak. This ensures that each item is represented once.
You can view all inventory items or stockable items only. The Inventory Type parameter allows you to select either option, as shown below.
.Automated Report
The report is available for automated delivery in Excel or CSV format. The report can include month-to-date or end-of-month data. You can customize profit centers included, by request. You can also receive the report for only stockable items, by request.